Deeper Insights,
Personalized Experiences
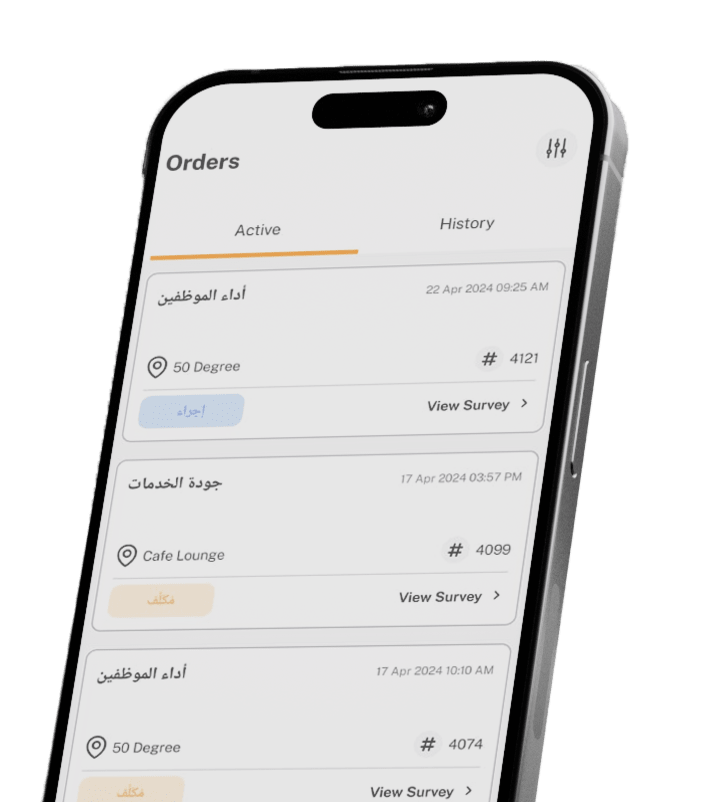
Easily design your surveys with various question types and themes using our drag-and-drop interface. For added convenience, our advanced AI can automatically generate industry-specific questions tailored to your needs.
Build Your Survey
Analyze responses, visualize data, and gain valuable insights with ease through your comprehensive Power BI reports and detailed executive summaries.
Powerful Analytics
Effortlessly create tailored surveys
with Our Al-Powered survey builder.
Al technology
Slide 1
Slide 2
Slide 3
Slide 4
Deeper Insights,
Personalized
Experiences
Build Your Survey
Easily design surveys with various question types and themes using our drag-and-drop interface.
Powerful Analytics
Analyze responses, visualize data, and export reports easily for valuable insights.
Al technology
Effortlessly Create Tailored Surveys With Our Al-Powered Builder For Seamless Data Collection.
Pleased To Work With
Data that Reflects Our Impact Across the Kingdom
We use data to showcase our reach and effectiveness. Our clients positive feedback and satisfaction with our service speak to our commitment to delivering exceptional results.
0
.0
K+
Business believe in our service
0
K+
Survey created
0
K+
Survey completed
0
K+
Active Agent
Choose a package that fits your needs.
Mystry Shopping
Market Research
Online Survey/Call Center
Data Collection
Inspection
👏 Let’s chat !
Curious to Learn More About Our Transformative Customer Experience Service? 🚀
Boost your business ⚡ with our powerful data insights and advanced reporting solutions.
"
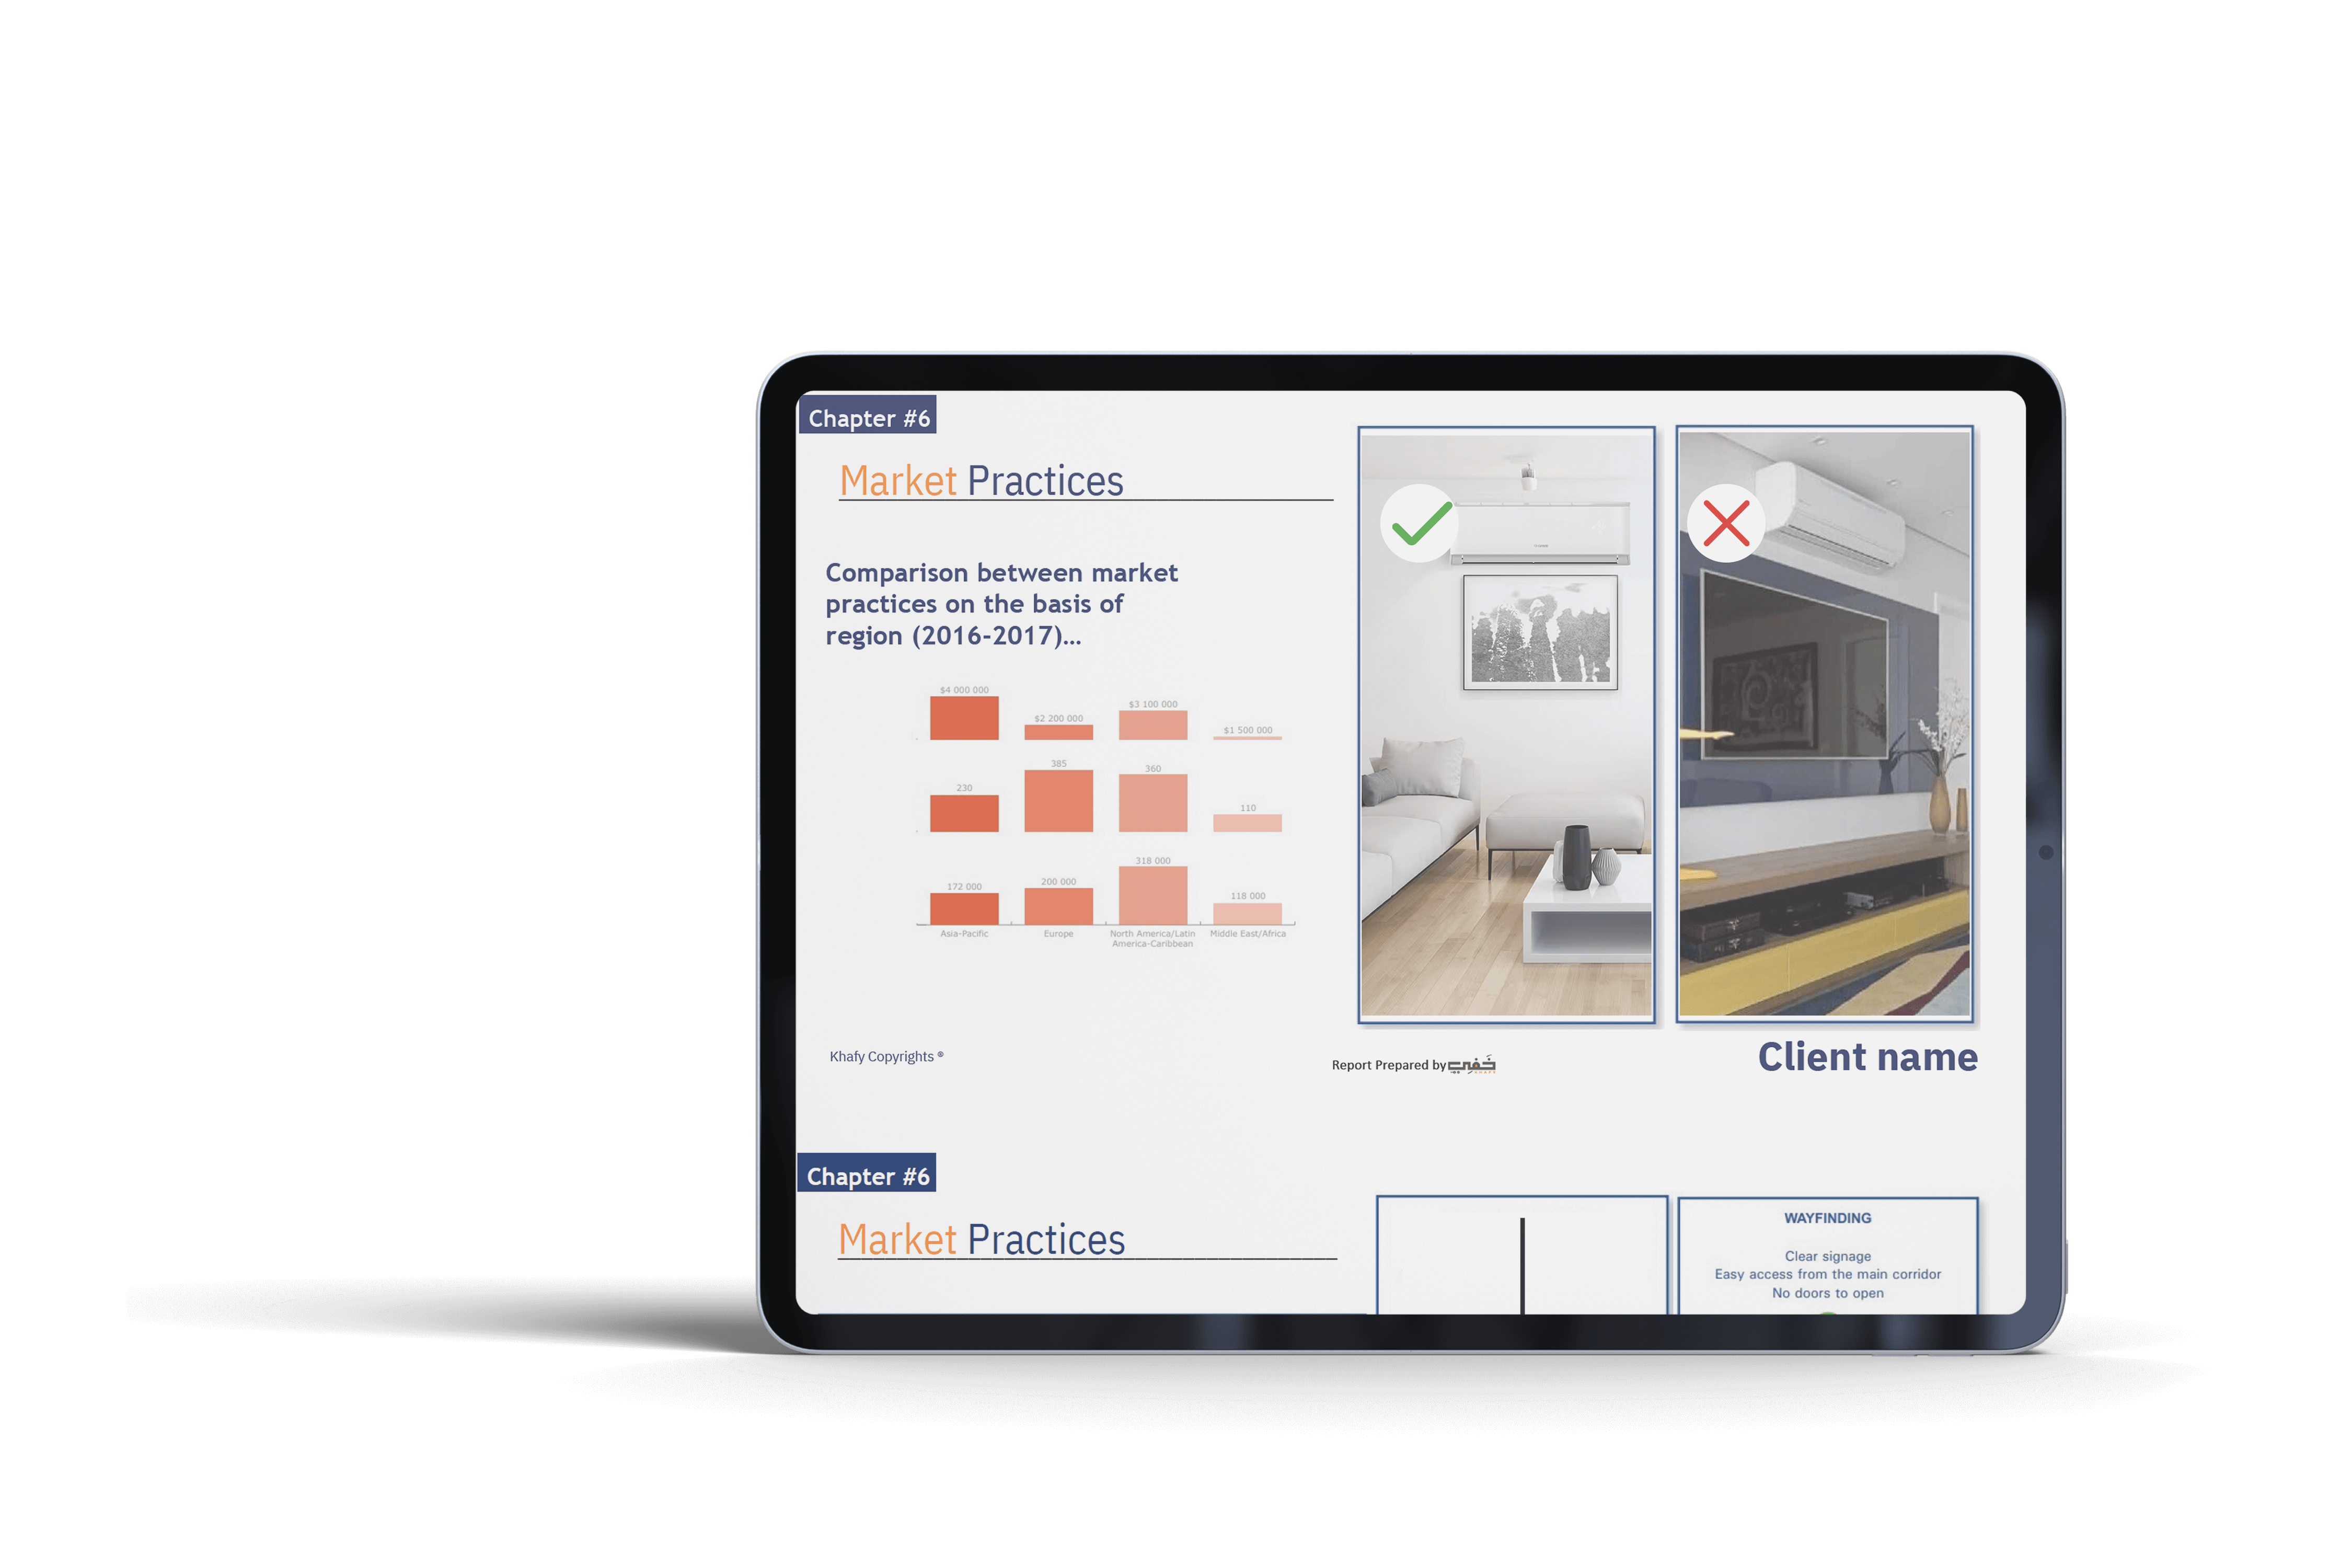
Executive Summary
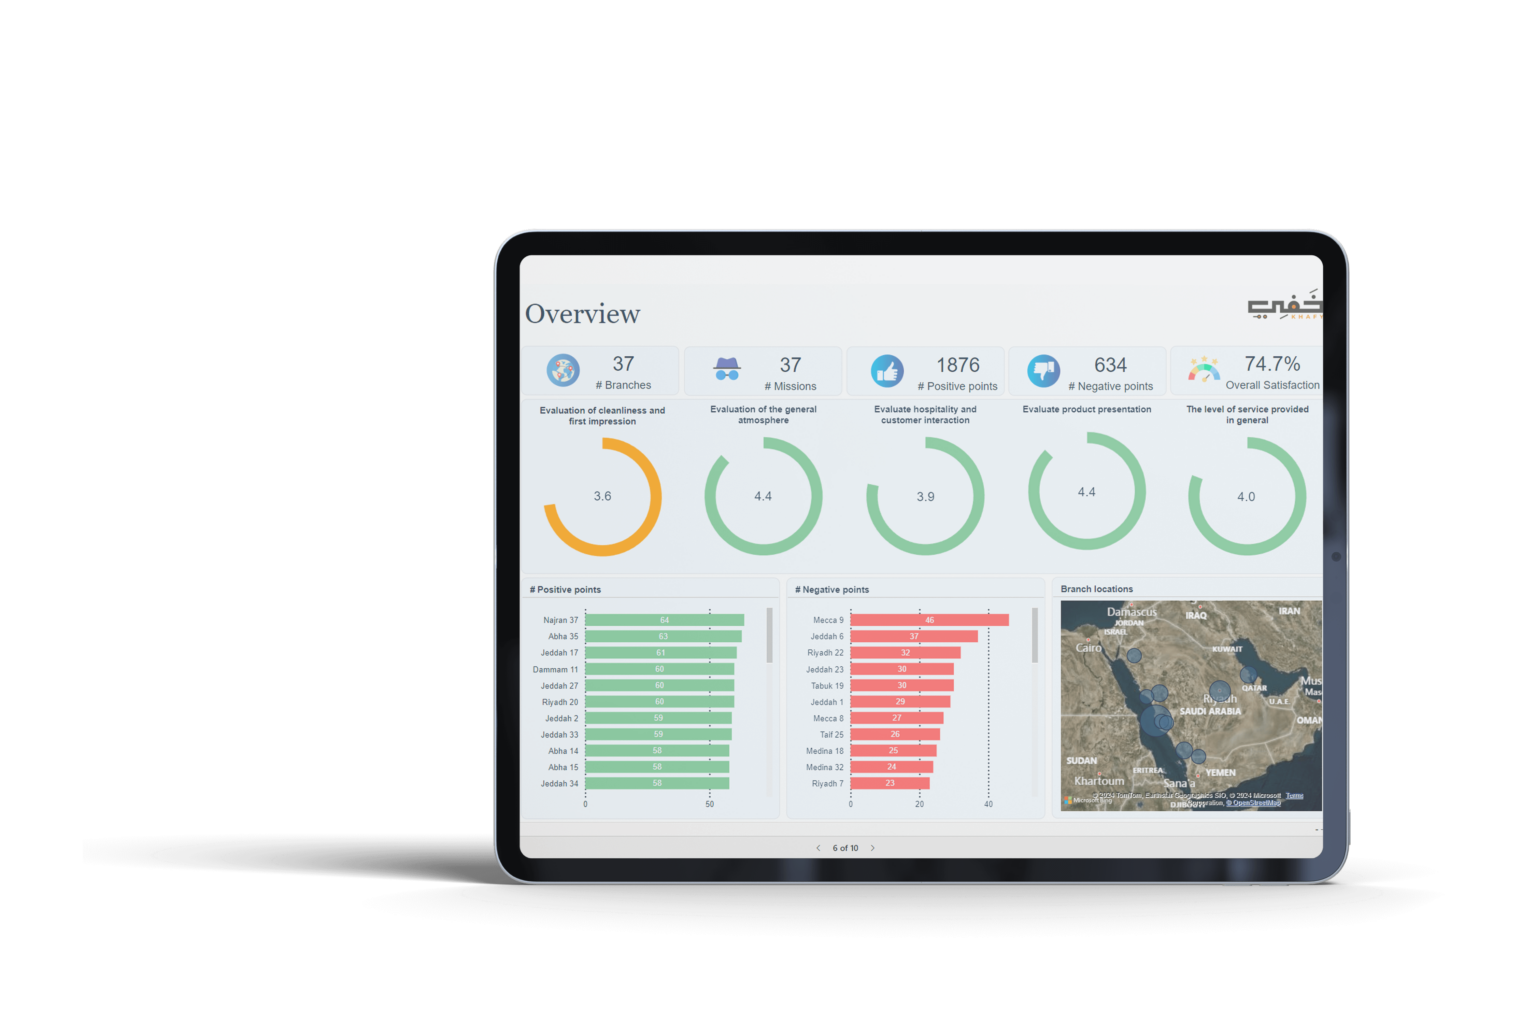
Power BI Report
Your
Executive
Summary
provides a concise overview of key findings, conclusions, and competitor highlights. It presents complex insights into clear, actionable information, helping decision-makers quickly grasp important details. Additionally, we provide practical recommendations and recommended action plan based on these insights, ensuring you have clear insights about your competitor strengths and strategic opportunities
By identifying best practices and international performance standards within the industry, benchmarking helps you understand where you stand relative to your competition. This comparison not only reveals areas where you excel but also uncovers opportunities for improvement
Reports transform your raw data into dynamic, interactive charts, graphs, and dashboards. Additionally, our reports enable comparison between current and previous sets of missions, as well as comparisons across branches. This enables you to track performance trends over time and benchmark performance, helping you make informed, data-driven decisions for business growth.
"OverJar - Khafy reports reflect the evolution of customer experiences and employee performance."
With the help of Khafy reports, we have gained a deep understanding of our customers’ journeys across various regions and demographics, enabling us to identify their needs effectively. We are now aware of the positive and negative aspects of each branch, which has guided us in making developmental decisions. Through Khafy reports, we have been able to evaluate our employees’ performance seamlessly across all branches and at different times, thanks to the mystery shopper. Khafy has delivered results in a short time with a unique and creative perspective.
"Green Health - Understanding the brand's market position and its competitors."
Khafy reports have helped us identify the strengths and weaknesses of each branch through percentage-based insights. Additionally, we’ve gained an understanding of customer experiences at other pharmacies, allowing us to enhance our own customer experience and employee performance. We are pleased to partner with Khafy and are committed to continuous improvement.